Premium Displacement
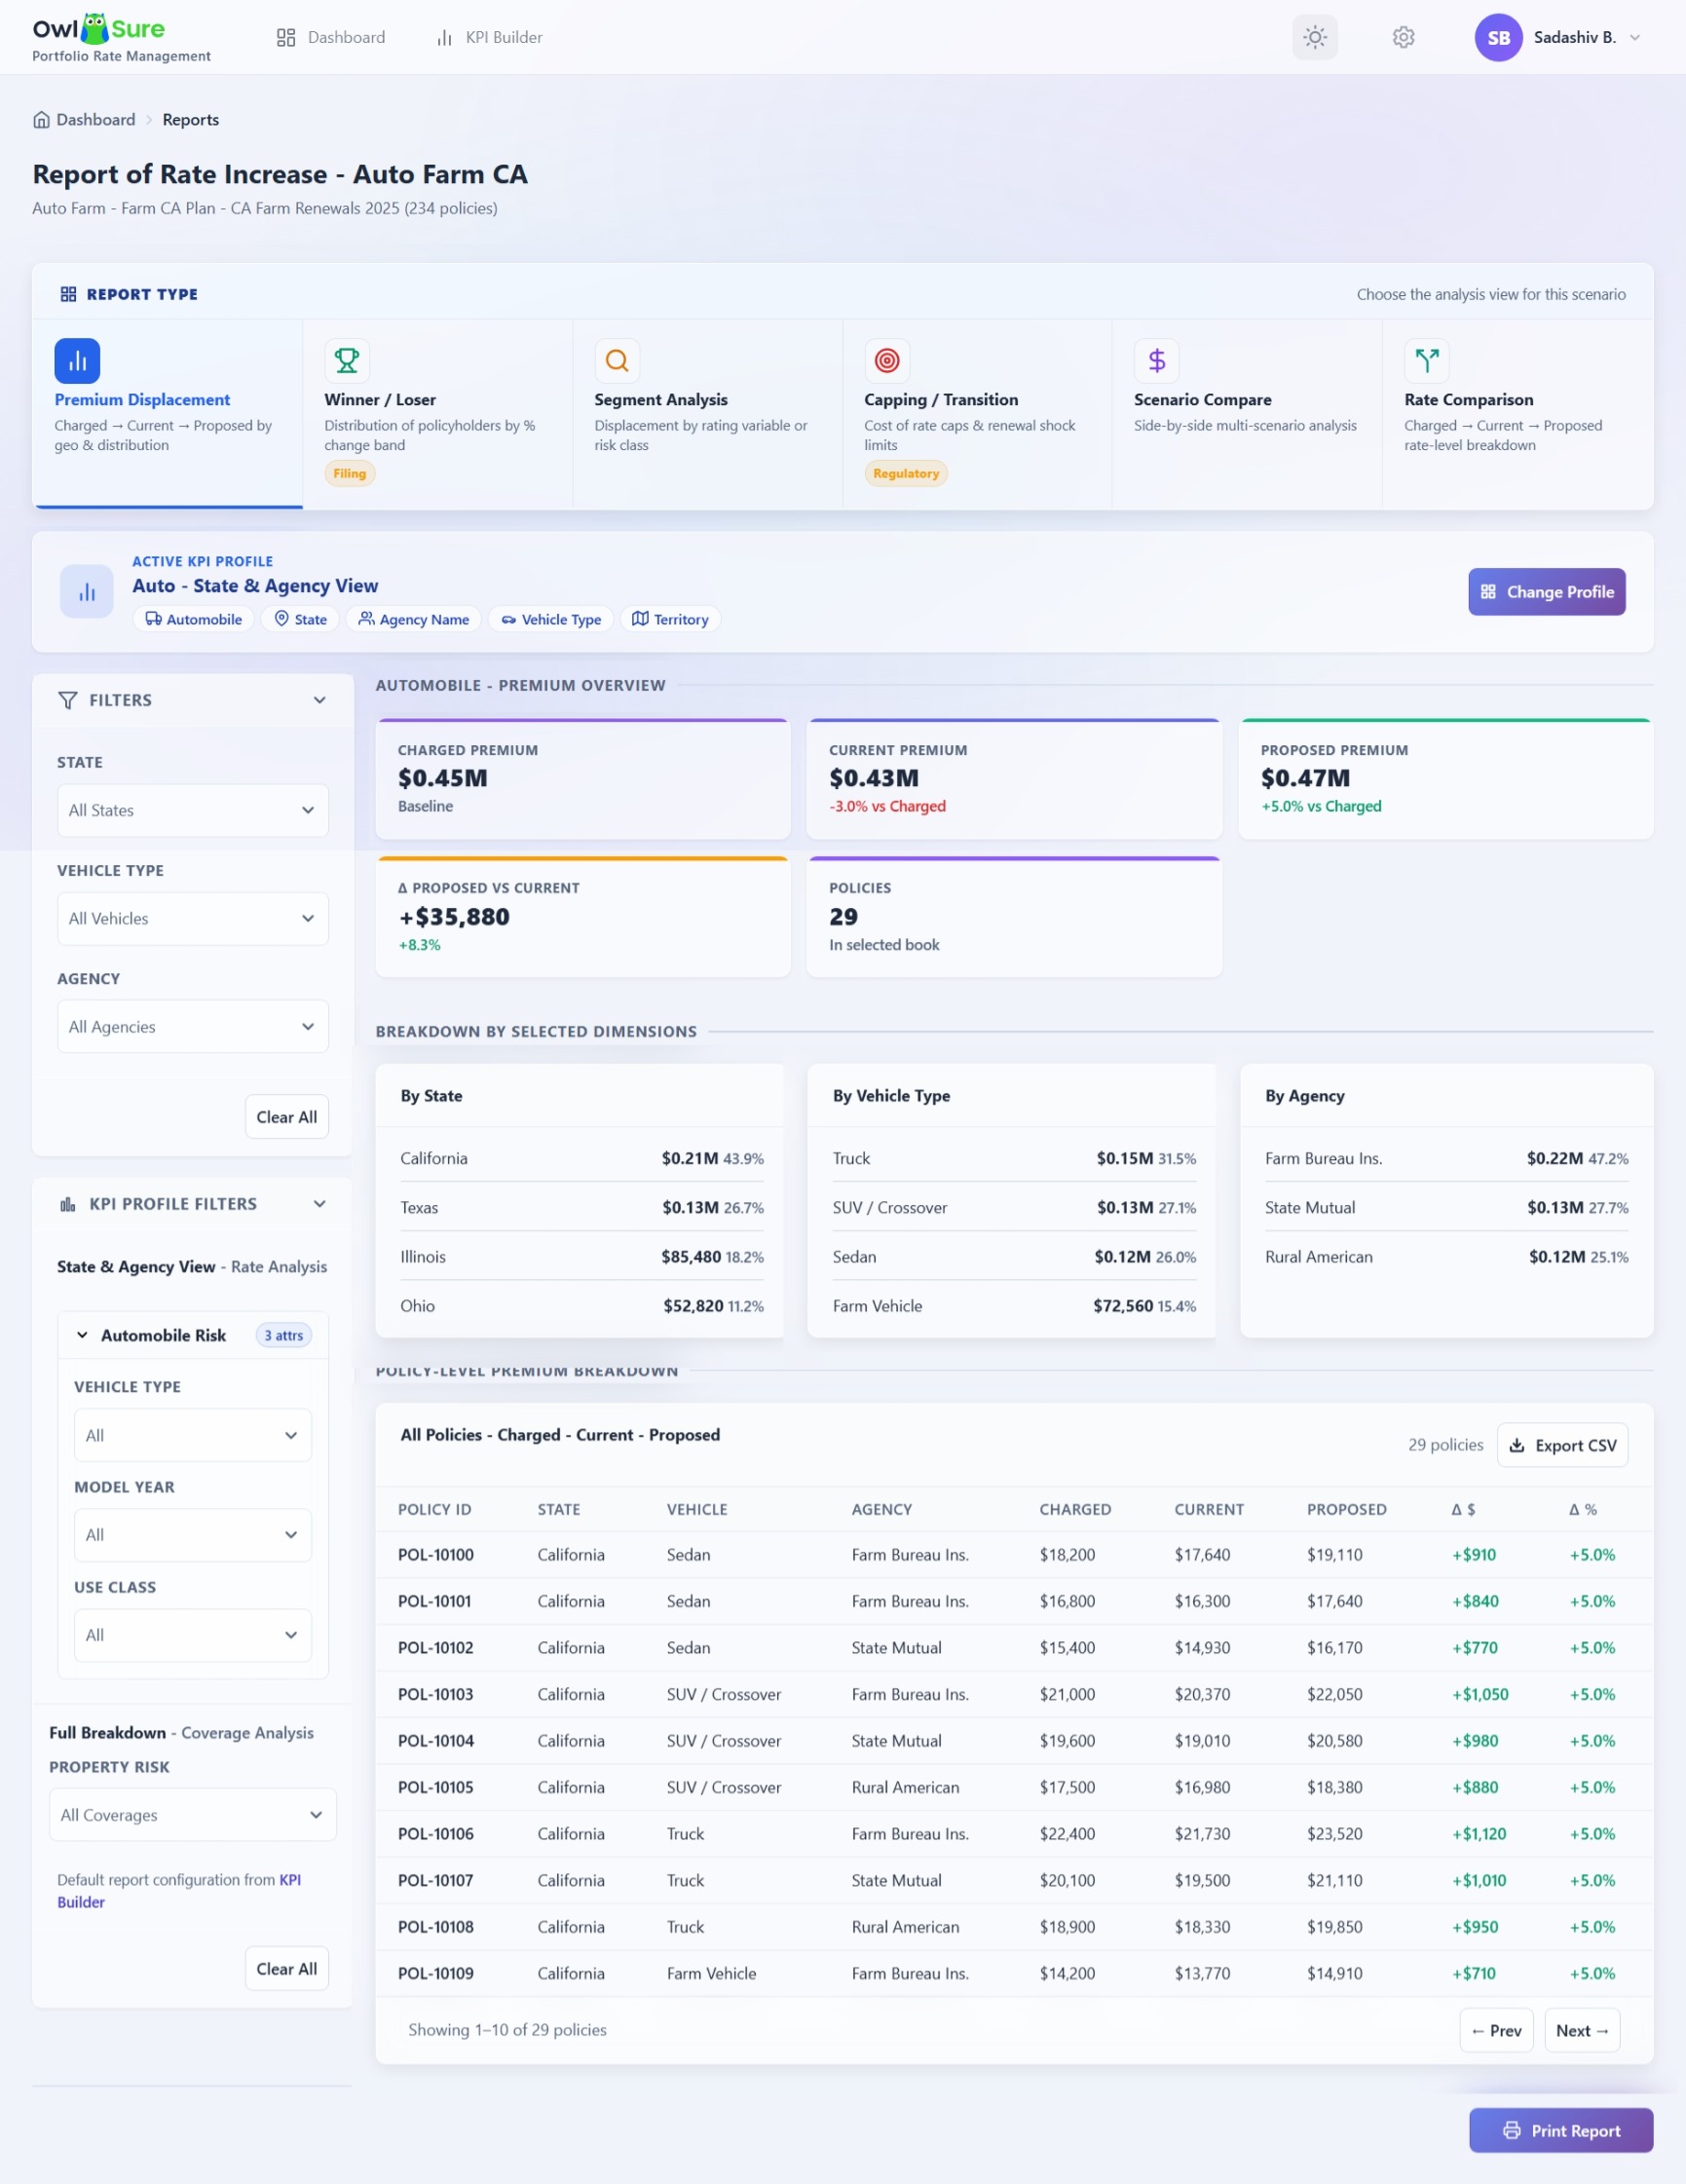
The Premium Displacement report provides comparative premium analysis across Charged, Current, and Proposed premium scenarios for the selected Book of Business. The report enables actuarial, pricing, and business users to evaluate premium movement, rate impact, and portfolio displacement resulting from proposed pricing changes.
The report supports portfolio-level, segment-level, and policy-level analysis with dynamic filtering and KPI-driven analytical breakdowns.
Premium Metrics
Charged Premium
Charged Premium represents the prior-period booked premium for the active Book of Business, calculated as the total charged premium across all in-scope policies selected for analysis.
Current Premium
Current Premium represents the premium recalculated by the rating engine using the currently active rates without applying any proposed scenario changes.
Formula
(Current − Charged) ÷ Charged × 100
Example
Charged Premium = $109.1K, Current Premium = $109.2K → Current vs Charged = +0.1%
Although both values may display identically after rounding, a small underlying precision difference can result in a displayed percentage uplift.
Proposed Premium
Proposed Premium represents the premium recalculated using the proposed rate changes configured within the What-If scenario.
Formula
(Proposed − Current) ÷ Current × 100
Example
Current Premium = $109.2K, Proposed Premium = $110.0K → Proposed vs Current = +0.6%
Total Uplift
Total Uplift represents the overall premium movement between Charged Premium and Proposed Premium across the entire in-scope portfolio.
Formula
(Proposed − Charged) ÷ Charged × 100
Example
Charged = $109.2K, Proposed = $110.0K, Difference = +$0.8K → Total Uplift = +0.71% (≈ +$0.8K)
Policy Metrics
The report displays the following policy counts:
| Metric | Description |
|---|---|
| Total Policies | Total number of in-scope policies included in the analysis |
| Active Policies | Policies currently in-force within the selected analysis period |
| Renewal Policies | Policies eligible for renewal during the selected evaluation period |
Policy-Level Premium Breakdown
The Policy-Level Premium Breakdown table provides detailed premium comparison for each individual policy across Charged, Current, and Proposed pricing scenarios.
| Column | Description | Formula |
|---|---|---|
| Charged | Original premium billed to the policyholder | - |
| Current | Premium recalculated using currently active rates | - |
| Δ Cur vs Chg | Percentage change between Current and Charged | (Current − Charged) ÷ Charged × 100 |
| Proposed | Premium recalculated using proposed scenario assumptions | - |
| Δ Prop vs Cur | Percentage change between Proposed and Current | (Proposed − Current) ÷ Current × 100 |
Breakdown by Selected Dimensions
The Breakdown by Selected Dimensions section displays the aggregated Proposed Premium distribution across the KPI dimensions selected in the active KPI profile, such as State, Vehicle Type, Agency, Territory, Coverage, Risk Type, and Driver Class.
Each dimension displays:
- Total Proposed Premium
- Percentage contribution to Total Proposed Premium
Formula
Dimension Proposed Premium = ∑ (Proposed Premium of all policies within the selected dimension)
Contribution % = (Dimension Proposed Premium ÷ Total Proposed Premium) × 100
Example — By State
California = ∑ (Proposed Premium for all California policies) = $0.21M → 0.21M ÷ 0.48M ≈ 43.9%
Dynamic Filtering
When filters are applied using dimensions such as ZIP Code, Territory, State, Vehicle Type, Agency Code, Writing Company, Coverage, or Risk Segment, all metrics — policy count, Charged Premium, Current Premium, Proposed Premium, and all percentage calculations — dynamically recalculate to reflect only the matching filtered policies.
Having trouble? Refer to our FAQs or Troubleshooting guide to know more.