Rate Comparison
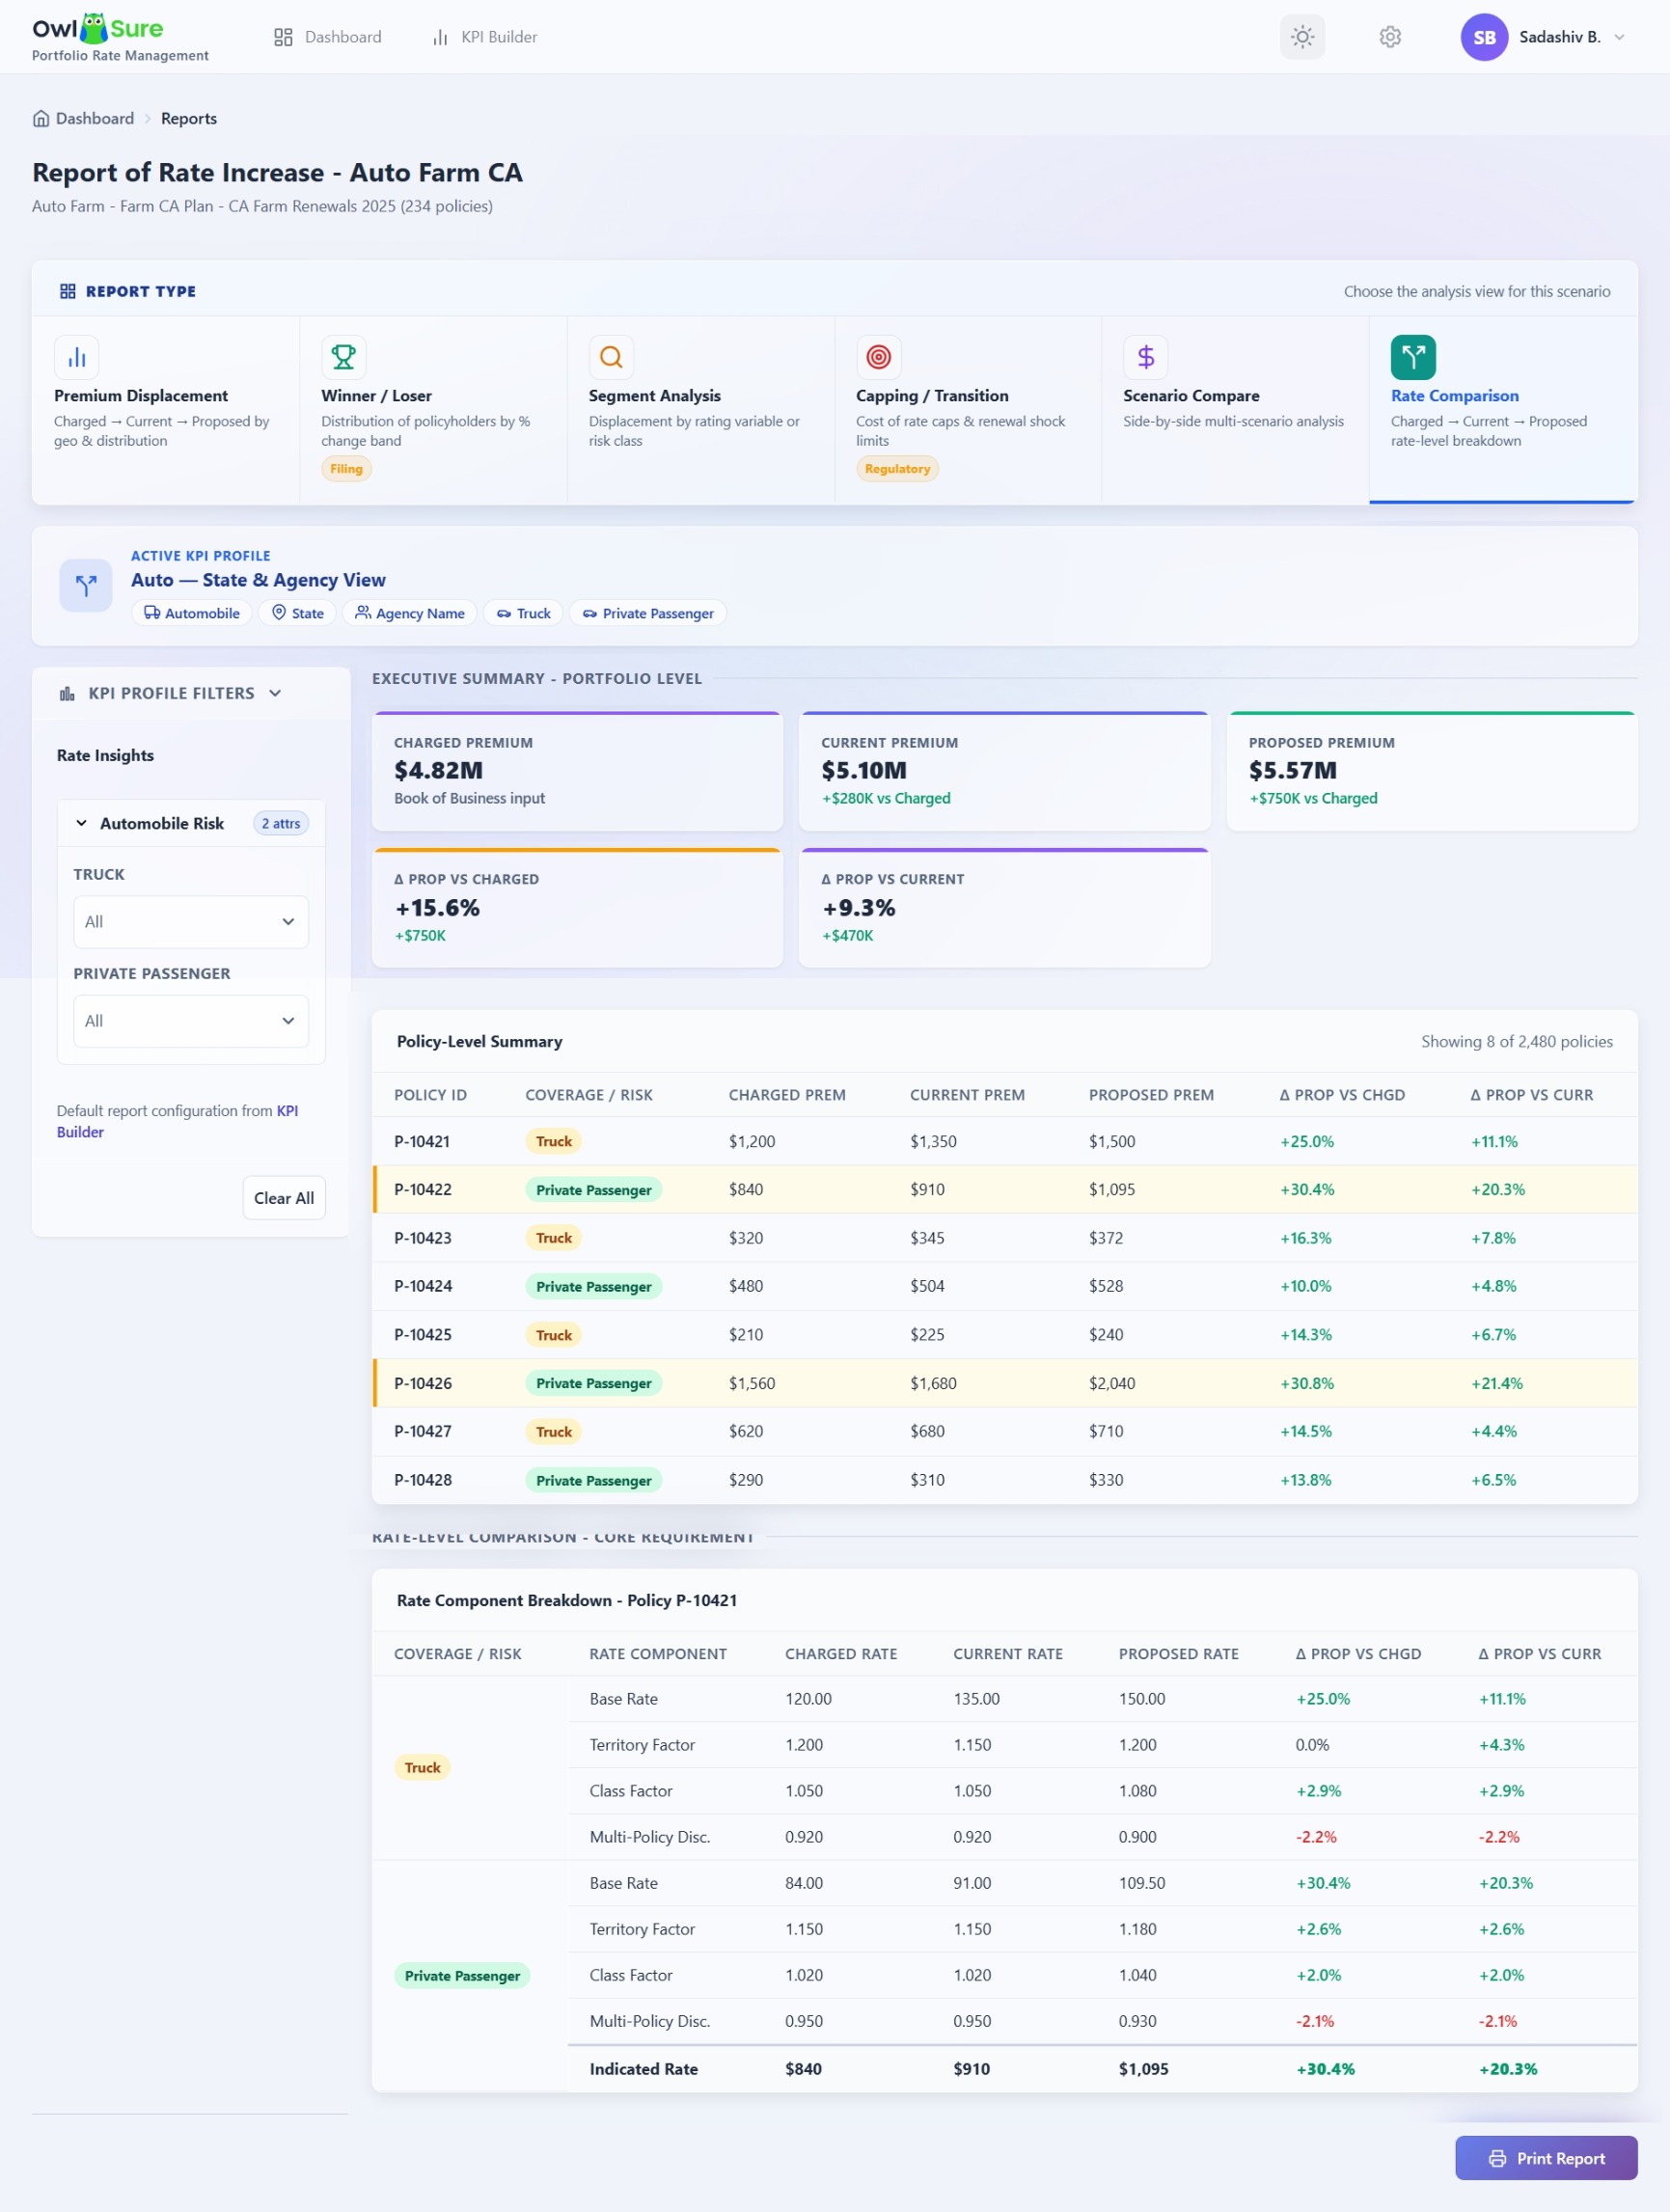
The Rate Comparison report provides policy-level and rate-component-level comparison between Charged, Current, and Proposed pricing scenarios. The report enables business users, actuarial teams, and pricing analysts to evaluate premium movement, rate factor impact, and pricing displacement at granular portfolio levels.
The report combines KPI-driven filtering, executive-level premium summaries, policy-level comparisons, and rate-component drill-down analysis to provide complete visibility into proposed pricing strategy impact.
Rate Comparison Types
| Rate Type | Description |
|---|---|
| Charged Rate | Actual premium currently charged on the Book of Business |
| Current Rate | Premium generated using the currently approved rate plan during rerating |
| Proposed Rate | Premium generated using the proposed What-If scenario rate plan |
KPI & Derived Attribute Selection
The report integrates with the KPI Builder framework to support configurable analytical dimensions for reporting, grouping, filtering, and drill-down analysis.
| Category | Examples |
|---|---|
| Risk Attributes | Risk Type, Risk Tier, Driver Class |
| Coverage Attributes | Liability, Collision, Comprehensive |
| Form Attributes | Endorsements, Forms |
| Vehicle Attributes | Vehicle Type, Vehicle Symbol |
| Premium Attributes | Premium Band, Change Band |
| Geographic Attributes | State, Territory |
| Policy Attributes | Policy Type, Renewal Type |
Report Output
Based on selected KPI dimensions and portfolio data, the report displays:
| Metric | Description |
|---|---|
| Charged Rate / Premium | Existing booked premium from Book of Business |
| Current Rate / Premium | Premium generated using current rate plan |
| Proposed Rate / Premium | Premium generated using proposed scenario |
| Variance | Difference between Current and Proposed premium |
| Percentage Change | Premium movement percentage |
Formula Logic
Proposed vs Current Percentage Change
(Proposed − Current) ÷ Current × 100
Proposed vs Charged Percentage Change
(Proposed − Charged) ÷ Charged × 100
Drill-Down Analysis
The report supports multi-level analytical drill-down across Policy, Coverage, Risk, Vehicle, Territory, Forms, Rating components, Premium bands, and derived KPI dimensions.
Dynamic Filtering
All report calculations dynamically update based on selected filters including State, Territory, ZIP Code, Vehicle Type, Coverage, Risk Tier, Policy Type, Renewal Type, Agent Code, Premium Bands, and Derived Attributes.
Having trouble? Refer to our FAQs or Troubleshooting guide to know more.