Segment Analysis
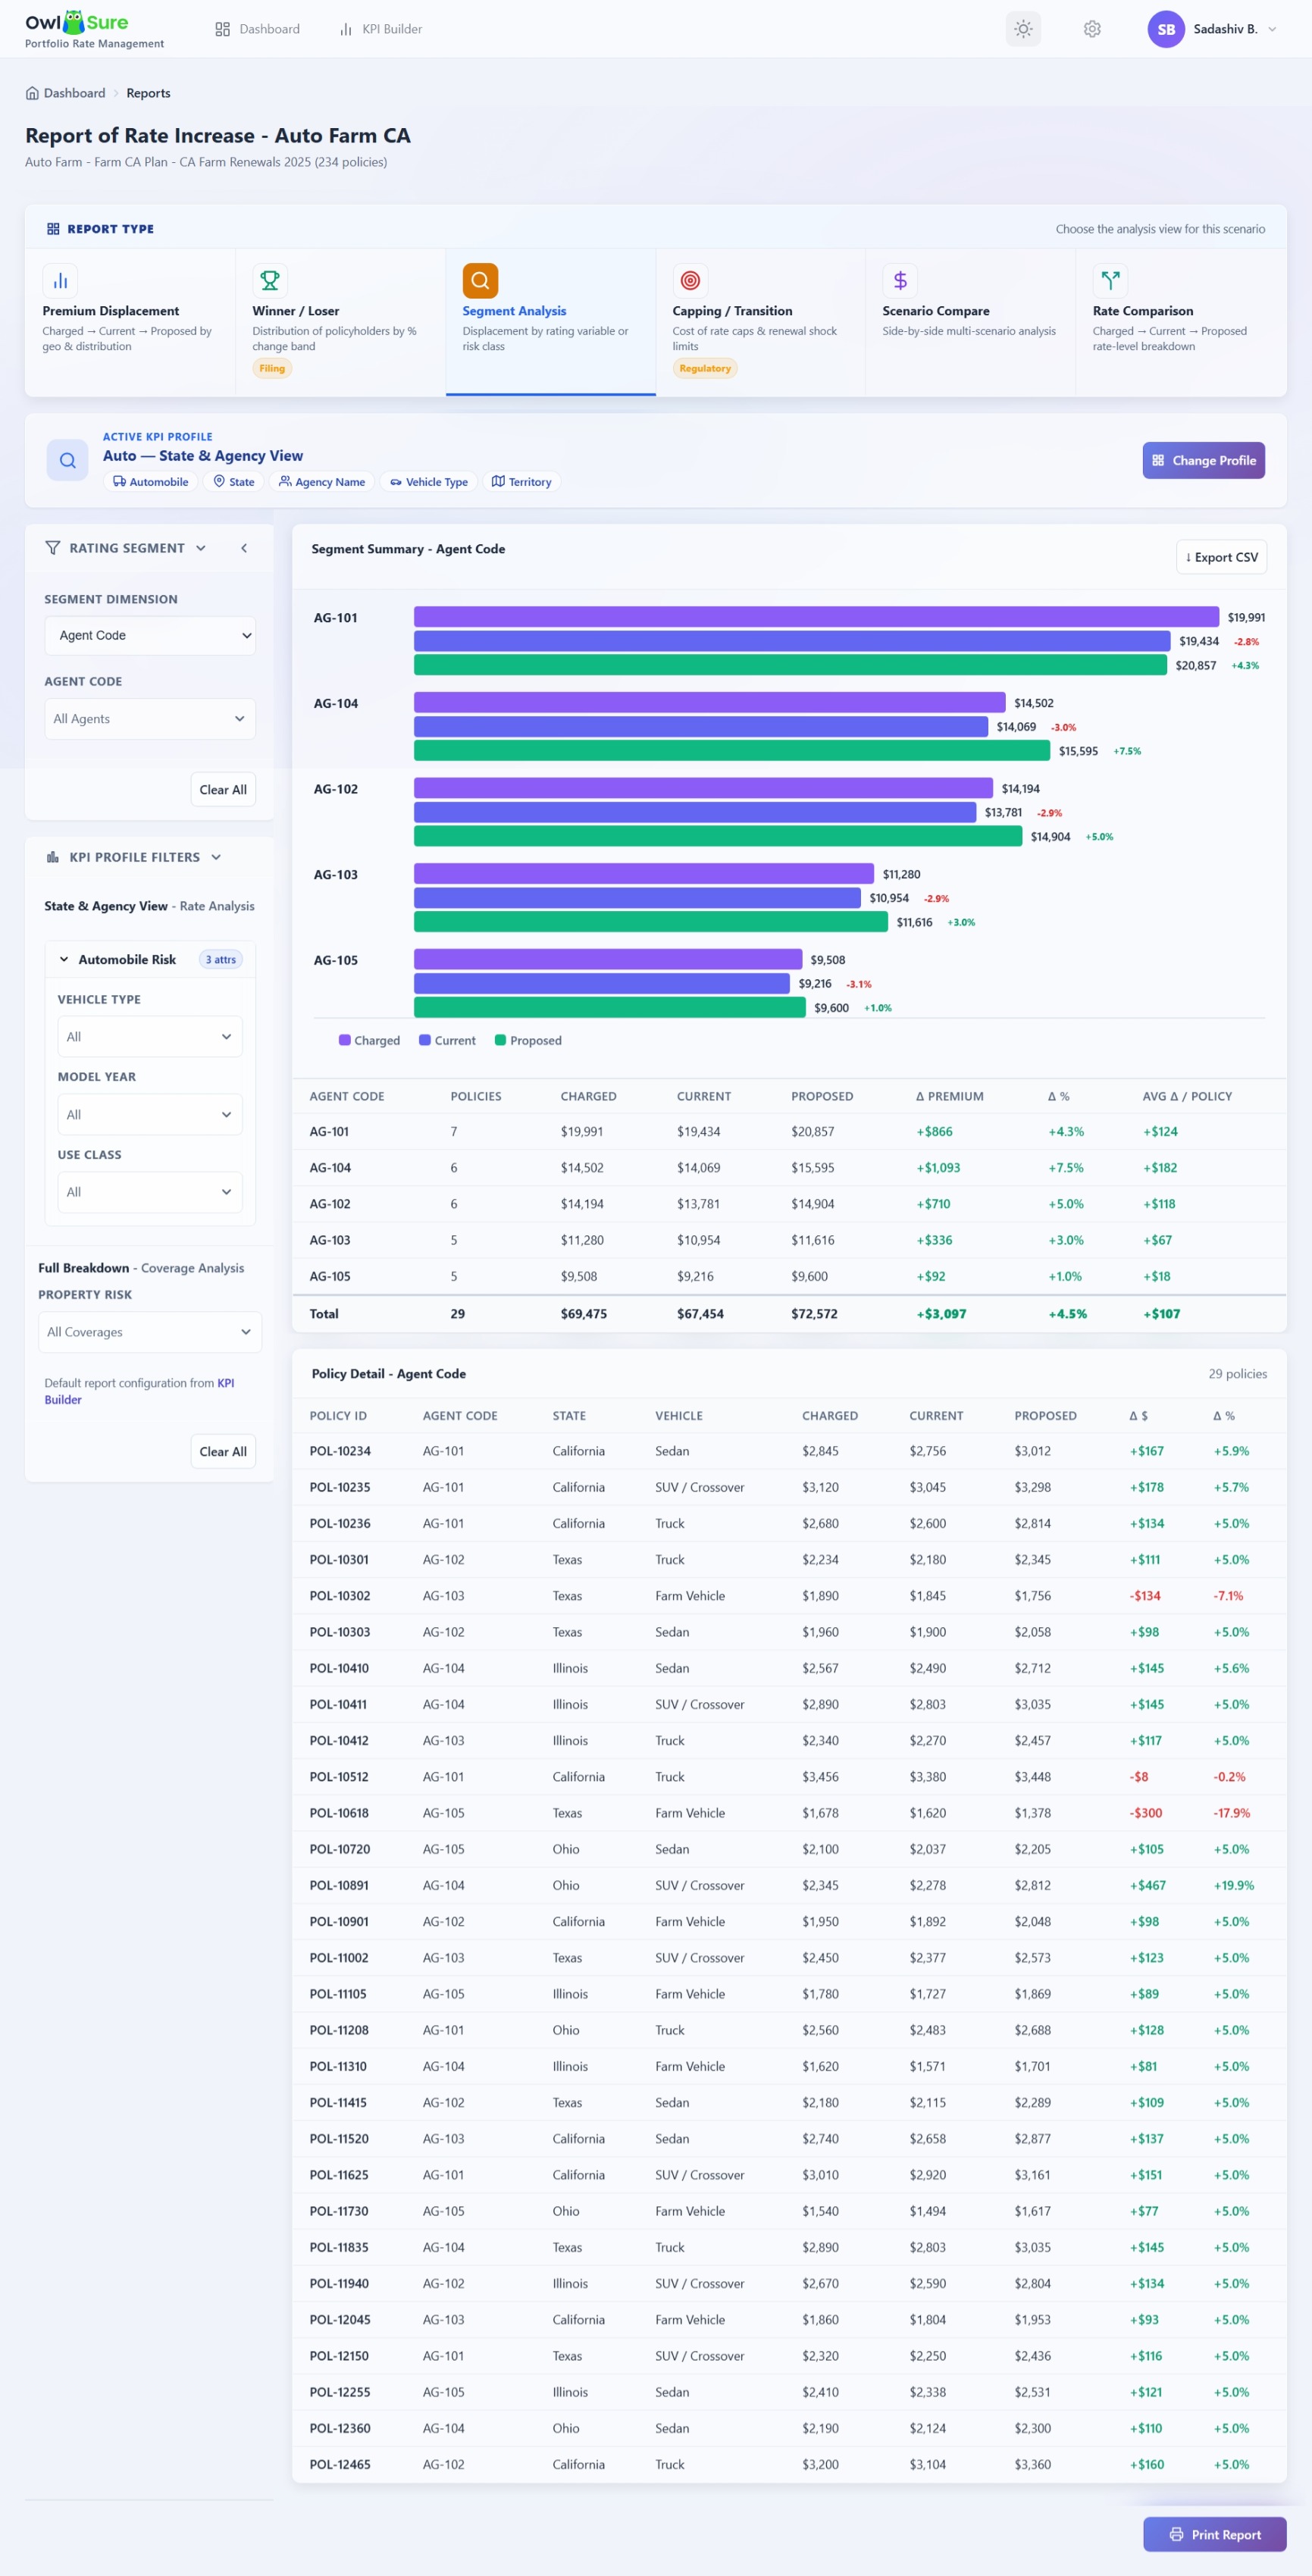
The Segment Analysis report provides premium displacement analysis across configurable business, rating, and risk dimensions such as Territory, Vehicle Type, Coverage, Policy Tenure, ZIP Code, State, and Agent Code. The report enables actuarial, pricing, underwriting, and business users to evaluate how premium movement varies across different portfolio segments under Current and Proposed pricing scenarios.
The report supports segment-level comparison, premium uplift analysis, portfolio contribution analysis, and policy-level drill-down reporting to identify high-impact segments, pricing imbalances, and concentration of premium changes within the portfolio.
Segment Selection
Users can switch analysis between dimensions such as Agent Code, Territory, ZIP Code, Vehicle Type, State, Policy Tenure, Coverage, Risk Category, and additional KPI dimensions. All analytical metrics dynamically recalculate based on the selected dimension.
Segment Summary
For each segment, the report displays the following metrics:
| Metric | Formula | Example (Agent 001) |
|---|---|---|
| Policies | Count of policies in segment | 26 |
| Charged Premium | ∑ Charged Premium | $36,867 |
| Current Premium | ∑ Current Premium | $39,817 |
| Proposed Premium | ∑ Proposed Premium | $43,475 |
| Current vs Charged (%) | (Current − Charged) ÷ Charged × 100 | - |
| Proposed vs Charged (%) | (Proposed − Charged) ÷ Charged × 100 | +17.9% |
The report visually compares premium movement across segments using graphical bar representation.
Example Segment Comparison
| Segment | Charged | Proposed | Δ% vs Charged |
|---|---|---|---|
| Agent 001 | $36,867 | $43,475 | +17.9% |
| Agent 002 | - | - | +8.0% |
| Agent 003 | - | - | +29.1% |
Policy Detail — Segment Drill-Down
The Policy Detail section enables drill-down from a segment summary into individual policy-level premium comparison.
| Column | Formula |
|---|---|
| Charged | Original billed premium |
| Current | Premium recalculated using current rates |
| Proposed | Premium recalculated using proposed scenario assumptions |
| Δ vs Charged | (Proposed − Charged) ÷ Charged × 100 |
Examples
William Foster: Charged = $648, Proposed = $955 → High premium increase
Thomas Anderson: Charged = $1,131, Proposed = $1,720 → Very high premium increase — critical pricing outlier
Joseph Martinez: Charged = $798, Proposed = $820 → Minimal premium movement — neutral impact
Dynamic Filtering
All segment-level and policy-level metrics dynamically update when filters are applied using State, Territory, ZIP Code, Agency, Vehicle Type, Coverage, Risk Category, Policy Tenure, and additional KPI dimensions.
Having trouble? Refer to our FAQs or Troubleshooting guide to know more.