Winner / Loser
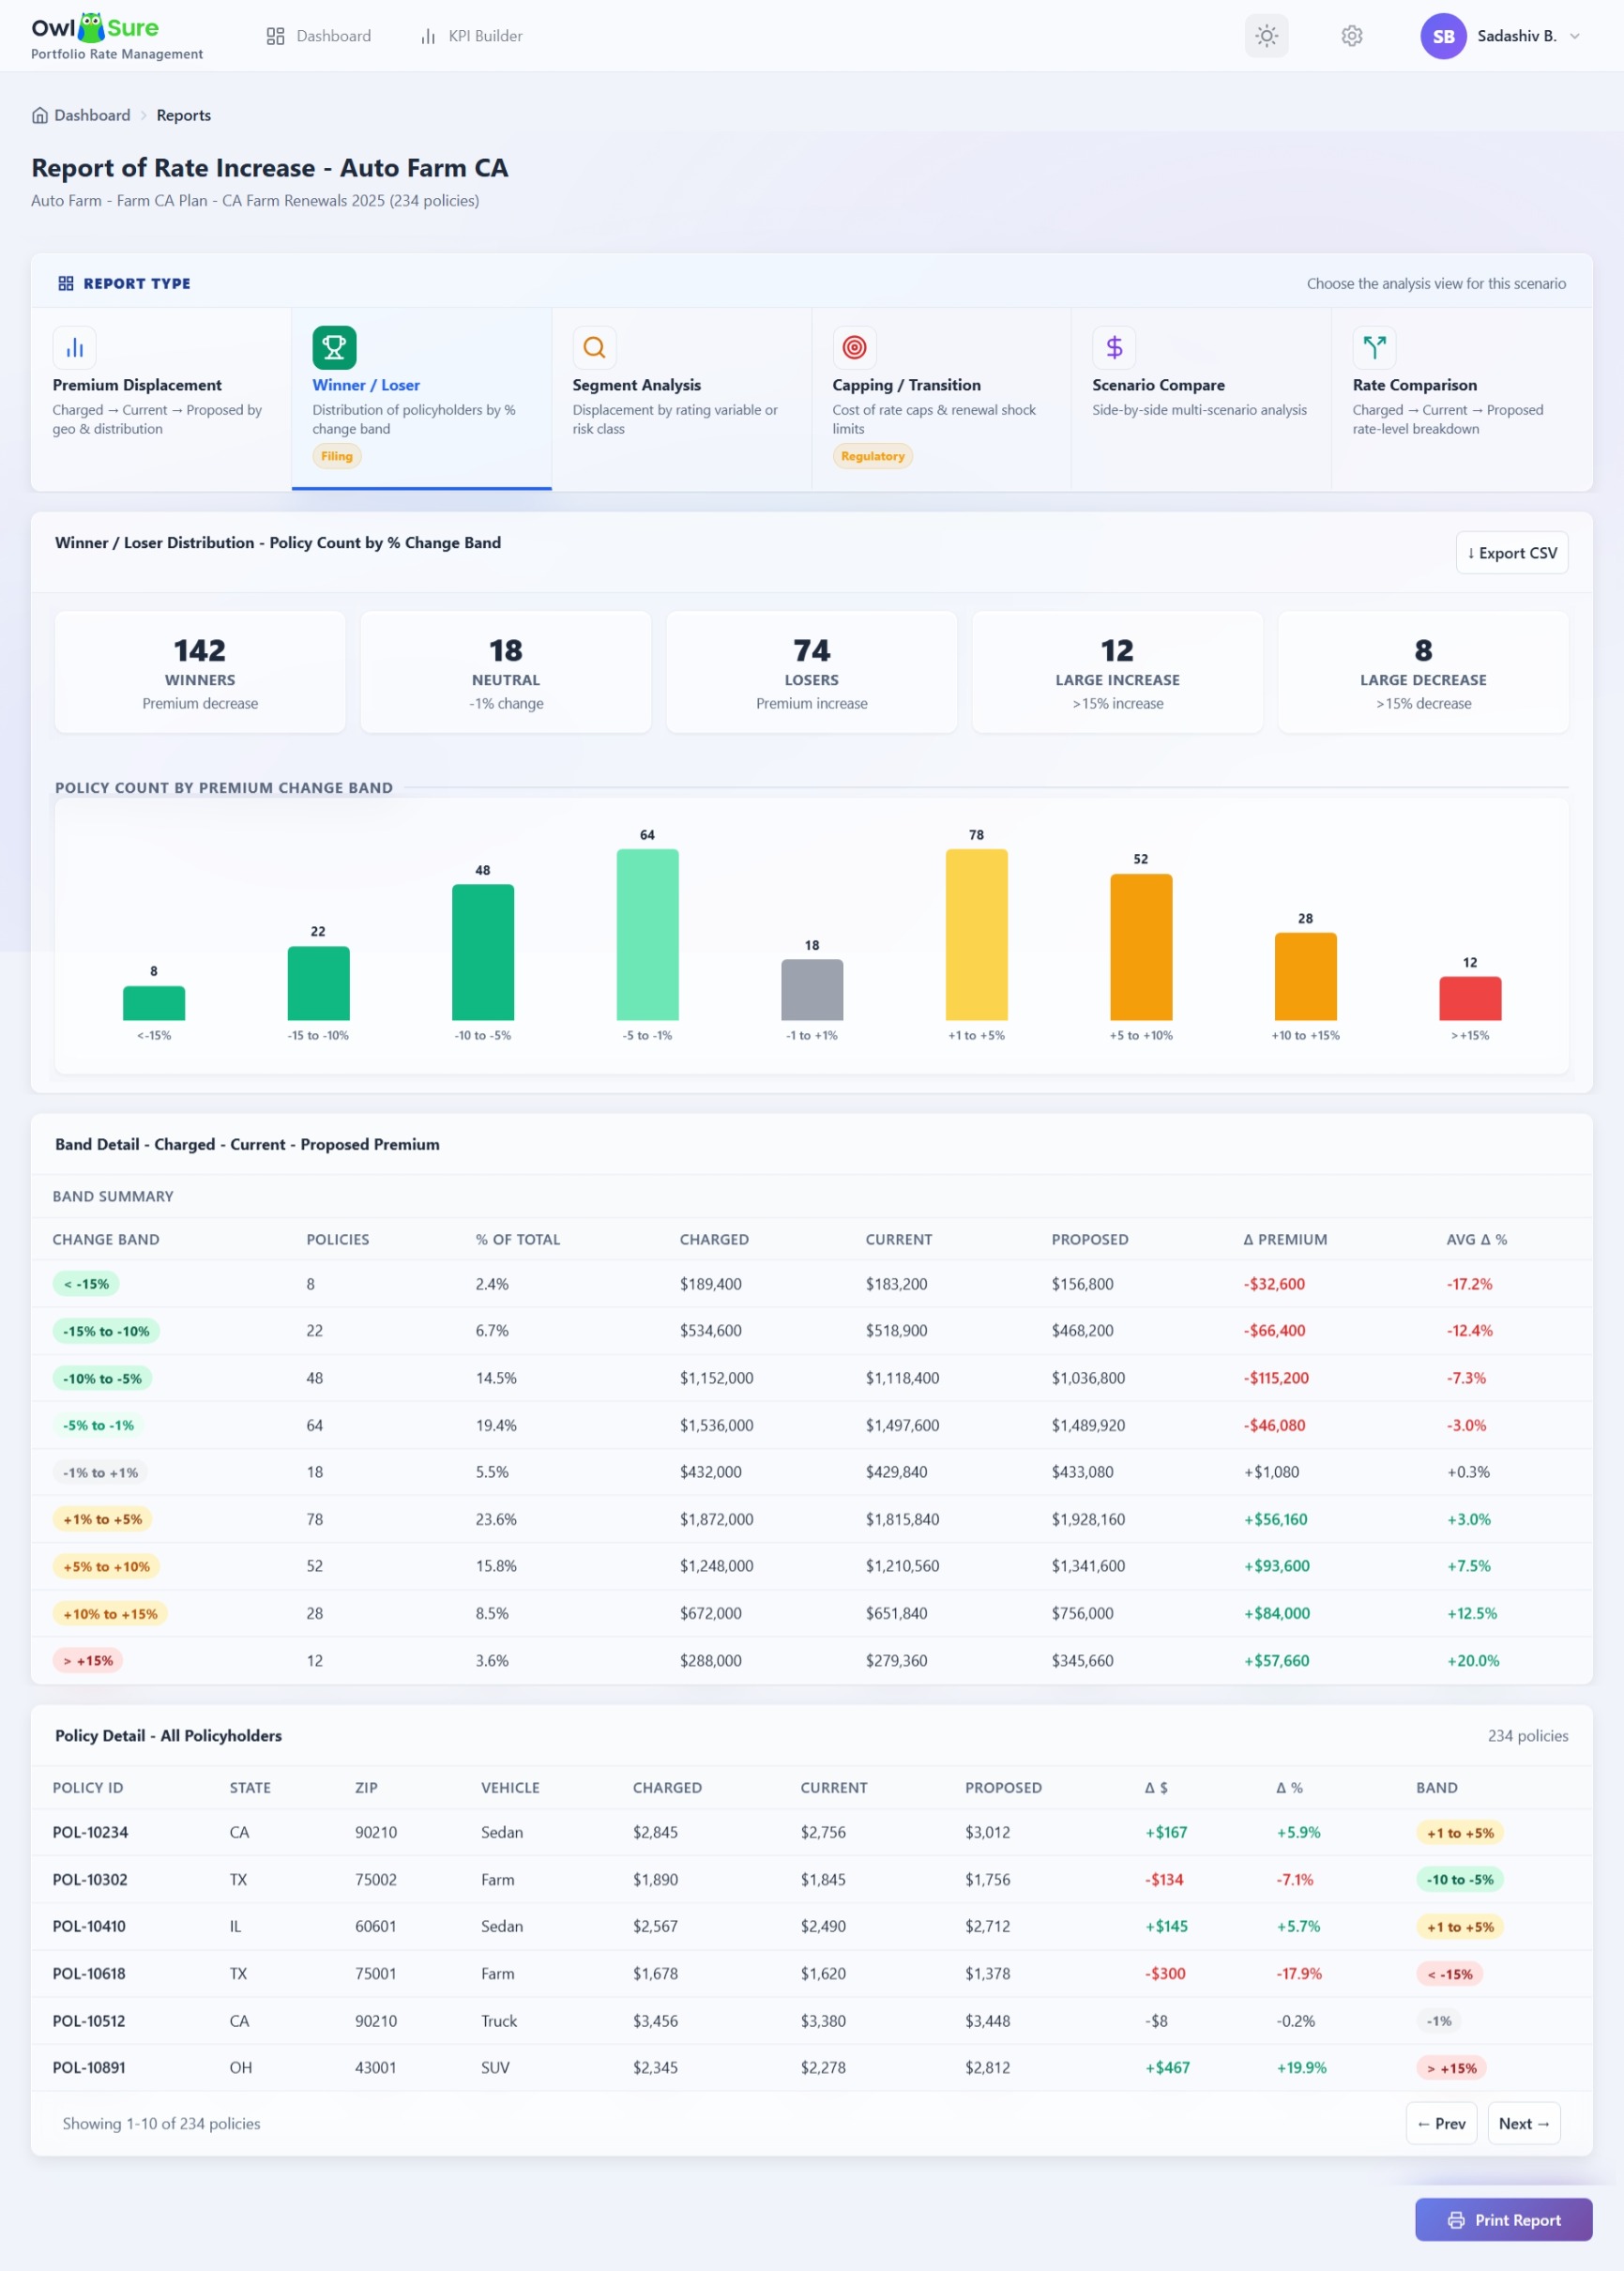
The Winner / Loser Analysis report provides policyholder impact analysis based on premium movement between Charged Premium and Proposed Premium. It categorizes policyholders into premium change bands to identify customers experiencing premium decreases (winners), premium increases (losers), or minimal premium impact.
The report enables actuarial, pricing, underwriting, and business teams to evaluate customer impact distribution, premium displacement concentration, renewal sensitivity, and pricing fairness before deploying rate changes into production.
Premium Change Bands
Policies are classified into five percentage-based bands using the movement between Charged Premium and Proposed Premium.
Policy-Level Percentage Change Formula
(Proposed − Charged) ÷ Charged × 100
| Band | Condition | Description |
|---|---|---|
| > 20% Decrease | % Change < −20% | Strong winners — significant premium reduction |
| 5–20% Decrease | −20% ≤ % Change < −5% | Moderate premium reduction |
| Within ±5% | −5% ≤ % Change ≤ +5% | Neutral — minimal premium movement |
| 5–20% Increase | +5% < % Change ≤ +20% | Moderate premium increase |
| > 20% Increase | % Change > +20% | Strong losers — significant premium increase |
Example Band Assignment
| Policy | Charged | Proposed | % Change | Band |
|---|---|---|---|---|
| Policy A | $1,000 | $750 | -25% | > 20% Decrease |
| Policy B | $1,000 | $920 | -8% | 5–20% Decrease |
| Policy C | $1,000 | $1,020 | +2% | Within ±5% |
| Policy D | $1,000 | $1,120 | +12% | 5–20% Increase |
| Policy E | $1,000 | $1,350 | +35% | > 20% Increase |
Band Detail Analysis
For each band, the report calculates the following aggregate metrics:
| Metric | Formula |
|---|---|
| Policy Count | Count of policies within the band |
| % of Book | Policies in Band ÷ Total Policies × 100 |
| Charged Premium | ∑ Charged Premium |
| Current Premium | ∑ Current Premium |
| Proposed Premium | ∑ Proposed Premium |
| Average Δ% vs Charged | (Total Proposed − Total Charged) ÷ Total Charged × 100 |
The Average Δ% vs Charged uses aggregate premium totals rather than a simple arithmetic average of policy percentages, to avoid skewing by policy count.
Example
Charged Premium = $31,179, Proposed Premium = $42,321 → Average Δ% = 37.7%
Validation
The report validates that aggregate totals across all bands sum to the portfolio totals:
- Total Policies = Sum of policies across all bands (e.g. 1 + 7 + 4 + 13 + 25 = 50)
- Total Charged Premium = Sum of Charged Premium across all bands
- Total Current Premium = Sum of Current Premium across all bands
- Total Proposed Premium = Sum of Proposed Premium across all bands
Policy Detail
The Policy Detail section provides granular premium comparison at individual policy level, enabling identification of high-impact policyholders, outlier premium movement, and renewal sensitivity.
| Column | Formula |
|---|---|
| Charged | Original premium billed to the policyholder |
| Current | Premium recalculated using existing rates without proposed changes |
| Proposed | Premium recalculated using proposed What-If scenario assumptions |
| Δ vs Charged | (Proposed − Charged) ÷ Charged × 100 |
Examples
James Harrington: Charged = $1,226, Proposed = $1,644 → Assigned Band: > 20% Increase
David Okafor: Charged = $2,163, Proposed = $2,063 → Assigned Band: Within ±5%
Having trouble? Refer to our FAQs or Troubleshooting guide to know more.